Chaining Outcomes: Strategic Bet Sequencing in Multi-Event Sports Wagering

Probability chains link individual event outcomes into a single calculated sequence where each result feeds into the next wager's parameters, allowing bettors to adjust stakes and selections based on updated likelihoods rather than treating matches as isolated decisions. This approach draws on conditional probability principles, where the occurrence of one event alters the odds for subsequent ones, and data from multi-sport calendars shows patterns that emerge when major fixtures cluster within short windows such as June 2026.
Defining Probability Chains in Practical Terms
Researchers at institutions including the University of Sydney's Gambling Research Centre have examined how bettors construct chains by converting decimal odds into implied probabilities, then multiplying those figures across events while accounting for bookmaker margins. A chain of three football matches, for instance, might begin with a team at 2.50 odds carrying a 40 percent implied chance, followed by a tennis set at 1.80 with a 55 percent chance, and a basketball quarter at 1.65 carrying roughly 60 percent; the product yields an overall chain probability before any adjustment for variance across correlated markets.
Studies published in the Journal of Gambling Studies demonstrate that chains perform differently when events share time zones or rest periods, because fatigue or travel factors create statistical dependencies that isolated bets overlook. Bettors who monitor injury reports between legs of a chain can revise the second and third selections in real time, replacing an initial assumption with a new probability derived from fresh inputs.
Constructing Sequences Across Calendar Windows
June 2026 features overlapping international tournaments and domestic finals that create natural sequencing opportunities, with data from European sports analytics firms showing clusters of three to five high-profile matches within 48-hour spans. One common method starts with a low-variance anchor event, such as a heavily favored home side in a league match, then branches into higher-variance selections once the anchor result updates the bankroll and risk tolerance. Observers note that this ordering reduces the impact of early losses on later legs because the chain can be recalibrated or abandoned before additional capital is committed.
Industry reports from the Canadian Centre for Gaming Research indicate that sequences spanning different sports, such as pairing a cricket total with a hockey period total, exhibit lower correlation than same-sport chains, which can stabilize the overall variance when probabilities are multiplied. Bettors therefore review historical cross-sport datasets to identify pairs where one outcome exerts minimal influence on the next, preserving the integrity of the calculated product.
Adjusting Stake Sizes Through Updated Likelihoods
Once the first leg resolves, the remaining chain probability shifts, prompting a recalculation of optimal stake using the new conditional odds. A sequence that began with a 25 percent overall chance might rise to 38 percent after a successful opening result, allowing proportional stake increases that reflect the revised mathematics rather than emotional momentum. Figures released by the Australian Institute of Family Studies in their gambling behavior reports reveal that participants who apply such recalibrations maintain steadier session lengths compared with those who fix stakes at the outset.
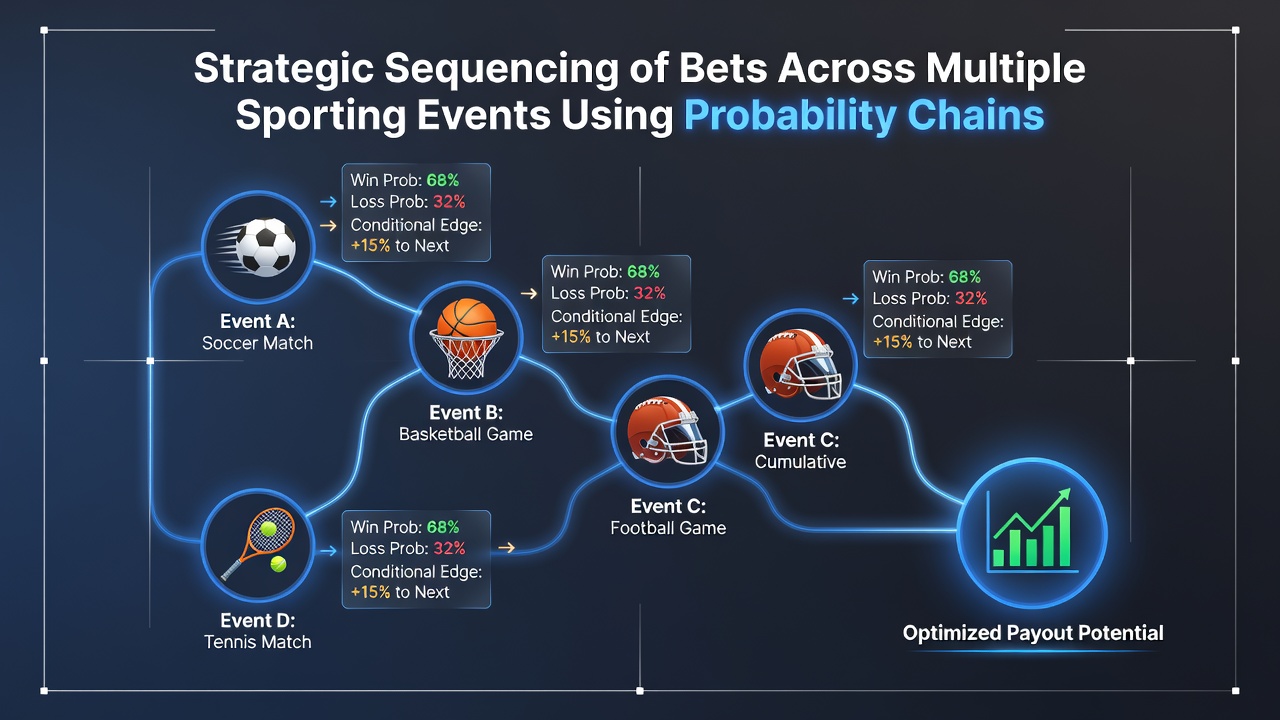
Software tools used by professional syndicates automate these updates by pulling live odds feeds and recalculating the product probability after each settlement, yet the underlying logic remains accessible through manual spreadsheets that track cumulative probability and remaining bankroll percentage. Those who maintain such records across multiple June windows report consistent documentation of how correlation between events, such as weather affecting both a daytime tennis match and an evening football fixture, alters the chain value.
Documented Patterns from Multi-Event Data Sets
Analysis of betting records spanning the 2024 European Championships and concurrent tennis majors showed that chains built around early-afternoon anchors produced higher completion rates when the first two legs cleared, because later events benefited from clearer team news. Similar patterns appear in North American datasets covering NBA playoff games paired with MLB night contests, where the shorter rest intervals between legs introduce measurable variance that probability models must incorporate. Government statistical agencies in several jurisdictions compile these datasets to track participation trends without endorsing specific strategies.
One documented case involved a sequence across three different continents during a June international window, where the bettor adjusted the third leg after the second result introduced an unexpected weather variable; the revised probability product still cleared, illustrating how dynamic updating preserves the chain's intended edge. Academic papers examining these adjustments emphasize that success hinges on accurate input data rather than the sequencing method alone.
Regulatory Context and Data Availability
Authorities such as the Nevada Gaming Control Board publish aggregated sports wagering figures that researchers use to model chain behavior across regulated markets, while the Victorian Commission for Gambling and Liquor Regulation in Australia supplies comparable statistics for southern hemisphere events. These sources allow analysts to test chain viability against real-world payout distributions without relying on single-operator data. Bettors seeking external benchmarks often cross-reference such reports with academic studies on conditional probability applications in sports.
Conclusion
Strategic sequencing through probability chains organizes multiple sporting events into linked calculations that update with each resolved outcome, drawing on conditional probability and historical correlation data. Reports from diverse regulatory bodies and research centers continue to supply the raw figures needed to test these sequences, particularly during concentrated June calendars that combine tournaments across continents. The method remains grounded in observable inputs and arithmetic adjustments rather than fixed predictions.