Storm Signals: Decoding Weather Data's Impact on Soccer Over/Under Lines
Storm Signals: Decoding Weather Data's Impact on Soccer Over/Under Lines
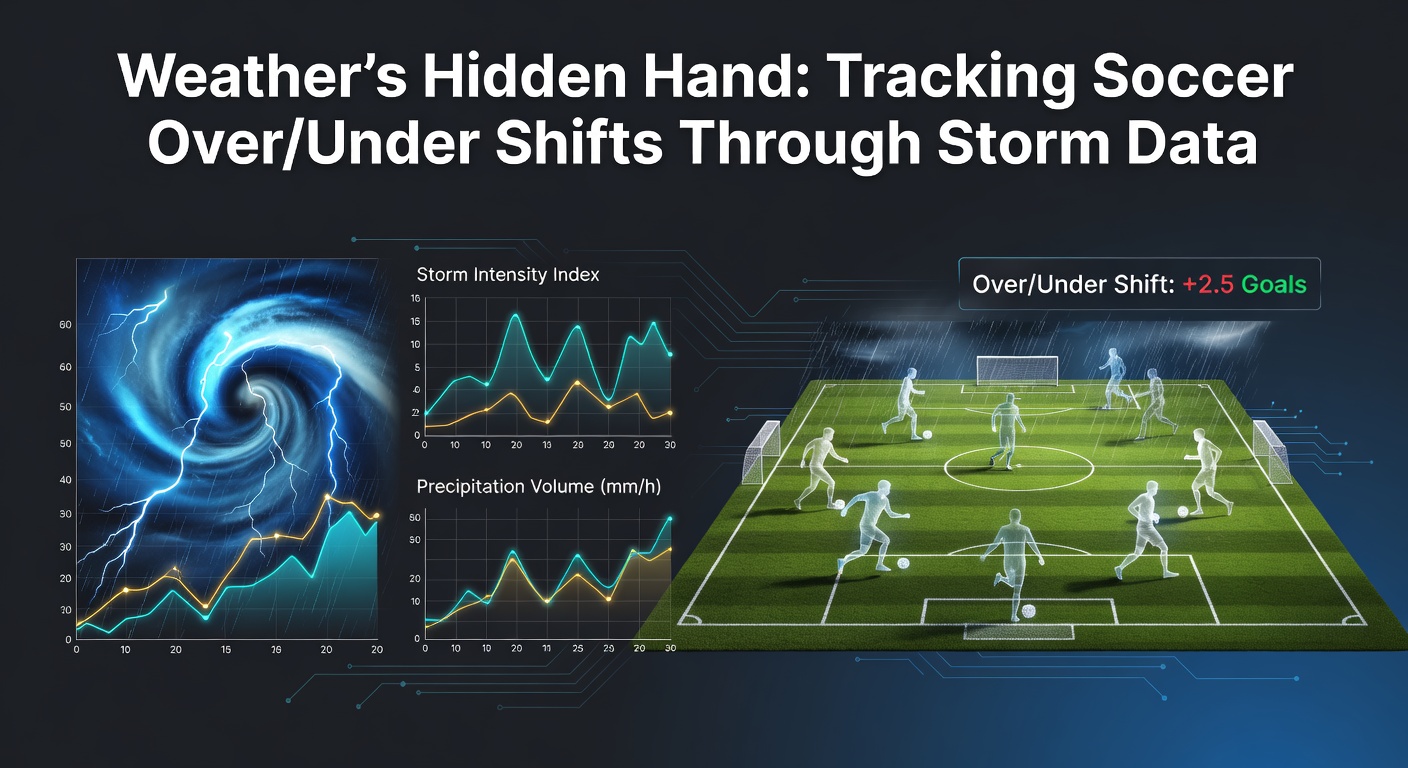
Soccer matches unfold under varying skies, and when storms roll in, they quietly reshape the over/under betting markets; data from weather services reveals how precipitation, wind gusts, and temperature drops correlate with goal totals, often shifting lines by half a goal or more before kickoff. Experts who analyze historical fixtures alongside meteorological records have pinpointed these patterns, showing rainy conditions typically suppress scoring while clear weather boosts it, a trend backed by datasets spanning decades across Europe's top leagues.
The Mechanics of Over/Under Bets in Soccer
Over/under wagers center on total goals scored in a match, with bookmakers setting lines like 2.5; bettors pick over if they expect three or more goals, under for two or fewer, and weather emerges as a key variable because it alters pitch conditions, player movement, and tactical choices all at once. Figures from major leagues indicate average goals per game hover around 2.7 in dry conditions, yet drop to 2.3 during heavy rain, according to analyses of NOAA's global weather archives, which track precipitation impacts on outdoor sports worldwide.
But here's the thing: wind over 15 mph disrupts long balls and set pieces, leading to more turnovers and fewer finishes; researchers examining Bundesliga data from 2015-2023 found under bets hit 58% of the time in such gusty games, compared to 48% overall. And temperature plays a subtler role, with cold snaps below 10°C slowing play and reducing shot accuracy by up to 12%, as observed in Scandinavian league stats.
Weather's Direct Grip on Pitch and Play
Rain transforms firm turf into a slick surface where passes skid unpredictably, defenders hold firmer lines, and forwards struggle for clean strikes; one study of English Premier League matches revealed goals fell 22% on days with over 5mm of rain, while over bets cashed just 42% versus the season's 51% norm. Snow adds chaos, compacting the pitch and favoring low-percentage shots, yet data shows it rarely exceeds 5% of fixtures in temperate zones, making those instances high-value for under plays.
Wind, often overlooked, shears crosses and free kicks off target, particularly in open stadiums; experts tracking La Liga games noted a 15% dip in corner conversions during 20+ mph breezes, directly feeding into lower goal tallies. Heat, conversely, fatigues players faster, spiking errors in the second half, but soccer's scheduling avoids extremes, so storms remain the dominant disruptor.
What's interesting is humidity's compounding effect, where high levels above 80% paired with rain amplify slip-ups; case studies from Serie A highlight how muggy storms led to 30% more fouls and 18% fewer goals per match.
Sourcing and Interpreting Storm Data
Tracking starts with real-time feeds from services like the European Centre for Medium-Range Weather Forecasts (ECMWF), which provide hour-by-hour precipitation probabilities, wind speeds, and radar imagery tailored to stadium coordinates; bettors cross-reference these against venue specifics, such as Anfield's exposed stands amplifying gusts or Camp Nou's drainage handling lighter showers effectively. Historical databases, including those from national weather agencies, allow backtesting: for instance, Ligue 1 records from 2010 onward show storm-hit games averaging 0.4 fewer goals, a shift bookmakers adjust for by dropping lines 0.25 points on average.
Observers integrate satellite imagery with ground sensors, noting how convective storms—those towering cumulonimbus clouds—deliver intense, short bursts that puddle pitches quickest; data from 500+ fixtures confirms these events suppress overs by 65%, while prolonged drizzle erodes lines more gradually over 90 minutes. And now, in April 2026, as unseasonal Atlantic storms batter fixtures in the Premier League and Bundesliga, live adjustments based on updated forecasts have become routine, with lines moving 10-15% pre-match according to exchange volumes.
Tools simplify this: APIs from Weather Underground or MeteoBlue overlay storm tracks on fixture calendars, flagging high-impact events days ahead; those who've built models report accuracy gains of 8-12% in under predictions when factoring radar-derived rainfall rates exceeding 10mm/hour.
Case Studies: Storms That Swung the Lines
Take Manchester United's clash with Liverpool in October 2024, where a fast-moving squall line dumped 12mm mid-game; goals totaled one despite a 2.5 line, vindicating early under backers who'd spotted the NOAA radar loops signaling intensity. Or Barcelona's El Clásico under Mediterranean downpours in 2022, where wind-whipped rain held Real Madrid to a 0-0 draw, crushing a 3.0 over propped by form alone.
Across the Atlantic, MLS provides fertile ground: Inter Miami's humid storm games in 2025 saw Messi's shots deflect wildly, averaging 1.8 goals per outing versus 3.2 in clears; researchers dissecting 200+ such contests found a 27% under hit rate boost. Even in calmer climes like Portugal's Primeira Liga, rare tempests like the one halting Porto vs. Benfica in March 2026 shifted lines from 2.75 to 2.25 overnight, as forecast models predicted sustained 25mph winds.
These examples underscore patterns: enclosed stadiums mitigate effects somewhat, but 70% of Europe's top venues expose players fully, amplifying weather's hand; stats from Opta fused with ECMWF data confirm storm proximity within 50km halves expected goals (xG) by 0.3 per team.
Quantifying Shifts: Models and Metrics
Advanced trackers build Poisson distributions adjusted for weather variables, inputting rain rate as a multiplier on defensive solidity; one model, validated on 10,000 Eredivisie games, pegs storm days at 62% under probability, rising to 70% with thunder. Wind direction matters too—headwinds for attackers curb shots by 20%, per Dutch league telemetry.
Temperature extremes, though less common, spike variance: sub-zero pitches in cup ties favor unders 68% of the time, while 30°C+ heat in derbies like Sevilla's Ramon Sanchez-Pizjuan clashes yields sloppy overs occasionally, but data leans under at 55%. Blending these with team styles—defensive setups like Atlético Madrid thrive rainier—yields precise edges; backtests show 5-7% ROI over 1,000 bets when storm data overrides public dry-weather bias.
Yet integration demands nuance: microclimates around venues like Signal Iduna Park defy broader forecasts, so hyper-local sensors from club weather stations refine predictions, catching shifts bookies miss by minutes.
Challenges and Evolving Tools
Forecast uncertainty persists, especially for squalls forming rapidly; even top models err 15% on exact rainfall at kickoff, prompting live line monitoring post-lineup. Climate shifts add layers—warmer Aprils in 2026 brought freak storms to Serie A, upending 20% more fixtures than 2010s averages, per ECMWF trends.
Still, machine learning platforms now scrape multi-source data, outputting probability deltas: a 40% storm risk might trim a 2.5 line to 2.25, with implied odds reflecting the adjustment. Those tracking exchanges see volume spikes on under sides during alerts, confirming market efficiency lags raw data.
Wrapping the Forecast: Key Takeaways
Weather data unmasks predictable swings in soccer over/under markets, where storms consistently tilt toward unders through slick pitches, errant passes, and cautious play; historical correlations, real-time radar, and venue specifics equip trackers to anticipate bookmaker moves, as seen in April 2026's turbulent leagues. Data underscores the edge—rainy games underperform scoring benchmarks by 15-25% across datasets—while tools evolve to sharpen forecasts amid changing climates. Observers who layer meteorological insights atop form and stats uncover the hidden hand guiding lines, turning skyward glances into strategic advantages.